For the sake of comparison, we use the ![]() confidence interval, using the values obtained by simulation and
presented in Table 1.
Table 4 summarizes that information in the following way:
every entry has either a ``Y'' or a ``N'', indicating weather the
corresponding confidence interval for the estimator/distribution
situation hits the true value (.5) or not.
Also, the number ``(j)'' indicates that the corresponding estimator,
besides hitting the confidence interval around the true value, has the
j smallest confidence interval for that distribution and that sizes.
confidence interval, using the values obtained by simulation and
presented in Table 1.
Table 4 summarizes that information in the following way:
every entry has either a ``Y'' or a ``N'', indicating weather the
corresponding confidence interval for the estimator/distribution
situation hits the true value (.5) or not.
Also, the number ``(j)'' indicates that the corresponding estimator,
besides hitting the confidence interval around the true value, has the
j smallest confidence interval for that distribution and that sizes.
The quality of this Monte Carlo study, when measured by the Mean Standard Deviations (Table 1), is reasonably good. Tables 2 and 3 suggest that this study could be continued in order to determine the asymptotic behaviour of the estimators; this could be the goal of a forthcoming study.
Within the considered size ranges and situations (the experimenter does not know, a priori, if the data come from the pure or contaminated distribution, henceforth all the situations must be considereded globally), the best estimator is the TML. Also, a very poor performance of the MAD estimator has been detected suggesting, thus, not to use it in these situations.
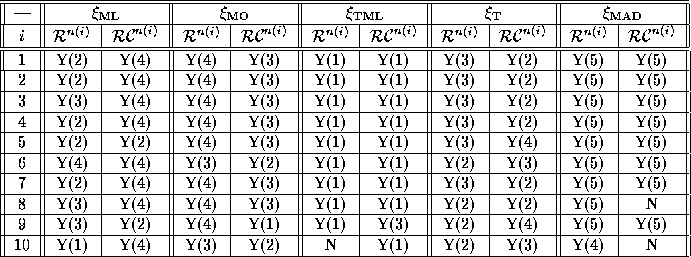
Table 4: Does the estimator hit the true value?
Table 5 presents the regression coefficients for the models
already introduced in equation (6).
Notice that, in every regression, ten points are considered; this is
not enough to make a detailed regression analysis, but we include these
results just to illustrate this important part of every simulation
study in Statistics.
Forward Regression was used, with the F-to-include
and F-to-remove values set to 4.
All the regressions discarded the use of explanatory variables;
i. e. all the ![]() , for
, for ![]() were
set to zero and the corresponding explanatory variable (
were
set to zero and the corresponding explanatory variable ( ![]() )
excluded from the model.
A residual analysis was performed for every regression (10 models),
showing no significant structures and, thus, validating the results.
)
excluded from the model.
A residual analysis was performed for every regression (10 models),
showing no significant structures and, thus, validating the results.
Table 5: Regressions coefficients.