Results for Round 2 - Unused variable task
Time Data
| |
Replic |
Subject |
SPL |
Technique |
time |
right |
| 1
|
1
|
1
|
Bestlap
|
EIs
|
288
|
Y
|
| 2
|
1
|
1
|
MobileMedia
|
No-EIs
|
423
|
H
|
| 3
|
1
|
2
|
Bestlap
|
No-EIs
|
457
|
N
|
| 4
|
1
|
2
|
MobileMedia
|
EIs
|
152
|
Y
|
| 5
|
2
|
1
|
Bestlap
|
No-EIs
|
271
|
Y
|
| 6
|
2
|
1
|
MobileMedia
|
EIs
|
139
|
Y
|
| 7
|
2
|
2
|
Bestlap
|
EIs
|
291
|
Y
|
| 8
|
2
|
2
|
MobileMedia
|
No-EIs
|
393
|
Y
|
| 9
|
3
|
1
|
Bestlap
|
No-EIs
|
352
|
N
|
| 10
|
3
|
1
|
MobileMedia
|
EIs
|
222
|
N
|
| 11
|
3
|
2
|
Bestlap
|
EIs
|
321
|
Y
|
| 12
|
3
|
2
|
MobileMedia
|
No-EIs
|
146
|
Y
|
| 13
|
4
|
1
|
Bestlap
|
EIs
|
171
|
Y
|
| 14
|
4
|
1
|
MobileMedia
|
No-EIs
|
161
|
Y
|
| 15
|
4
|
2
|
Bestlap
|
No-EIs
|
406
|
H
|
| 16
|
4
|
2
|
MobileMedia
|
EIs
|
256
|
Y
|
| 17
|
5
|
1
|
Bestlap
|
EIs
|
236
|
Y
|
| 18
|
5
|
1
|
MobileMedia
|
No-EIs
|
172
|
Y
|
| 19
|
5
|
2
|
Bestlap
|
No-EIs
|
1057
|
N
|
| 20
|
5
|
2
|
MobileMedia
|
EIs
|
242
|
Y
|
| 21
|
6
|
1
|
Bestlap
|
EIs
|
264
|
H
|
| 22
|
6
|
1
|
MobileMedia
|
No-EIs
|
146
|
Y
|
| 23
|
6
|
2
|
Bestlap
|
No-EIs
|
459
|
H
|
| 24
|
6
|
2
|
MobileMedia
|
EIs
|
87
|
Y
|
| 25
|
7
|
1
|
Bestlap
|
EIs
|
266
|
Y
|
| 26
|
7
|
1
|
MobileMedia
|
No-EIs
|
217
|
H
|
| 27
|
7
|
2
|
Bestlap
|
No-EIs
|
513
|
H
|
| 28
|
7
|
2
|
MobileMedia
|
EIs
|
462
|
Y
|
|
Time Data with Standard Deviation for Wrong Answers; SD = 188
| |
Replic |
Subject |
SPL |
Technique |
time |
right |
| 1
|
1
|
1
|
Bestlap
|
EIs
|
288
|
Y
|
| 2
|
1
|
1
|
MobileMedia
|
No-EIs
|
517
|
H
|
| 3
|
1
|
2
|
Bestlap
|
No-EIs
|
645
|
N
|
| 4
|
1
|
2
|
MobileMedia
|
EIs
|
152
|
Y
|
| 5
|
2
|
1
|
Bestlap
|
No-EIs
|
271
|
Y
|
| 6
|
2
|
1
|
MobileMedia
|
EIs
|
139
|
Y
|
| 7
|
2
|
2
|
Bestlap
|
EIs
|
291
|
Y
|
| 8
|
2
|
2
|
MobileMedia
|
No-EIs
|
393
|
Y
|
| 9
|
3
|
1
|
Bestlap
|
No-EIs
|
540
|
N
|
| 10
|
3
|
1
|
MobileMedia
|
EIs
|
410
|
N
|
| 11
|
3
|
2
|
Bestlap
|
EIs
|
321
|
Y
|
| 12
|
3
|
2
|
MobileMedia
|
No-EIs
|
146
|
Y
|
| 13
|
4
|
1
|
Bestlap
|
EIs
|
171
|
Y
|
| 14
|
4
|
1
|
MobileMedia
|
No-EIs
|
161
|
Y
|
| 15
|
4
|
2
|
Bestlap
|
No-EIs
|
500
|
H
|
| 16
|
4
|
2
|
MobileMedia
|
EIs
|
256
|
Y
|
| 17
|
5
|
1
|
Bestlap
|
EIs
|
236
|
Y
|
| 18
|
5
|
1
|
MobileMedia
|
No-EIs
|
172
|
Y
|
| 19
|
5
|
2
|
Bestlap
|
No-EIs
|
1245
|
N
|
| 20
|
5
|
2
|
MobileMedia
|
EIs
|
242
|
Y
|
| 21
|
6
|
1
|
Bestlap
|
EIs
|
358
|
H
|
| 22
|
6
|
1
|
MobileMedia
|
No-EIs
|
146
|
Y
|
| 23
|
6
|
2
|
Bestlap
|
No-EIs
|
553
|
H
|
| 24
|
6
|
2
|
MobileMedia
|
EIs
|
87
|
Y
|
| 25
|
7
|
1
|
Bestlap
|
EIs
|
266
|
Y
|
| 26
|
7
|
1
|
MobileMedia
|
No-EIs
|
311
|
H
|
| 27
|
7
|
2
|
Bestlap
|
No-EIs
|
607
|
H
|
| 28
|
7
|
2
|
MobileMedia
|
EIs
|
462
|
Y
|
|
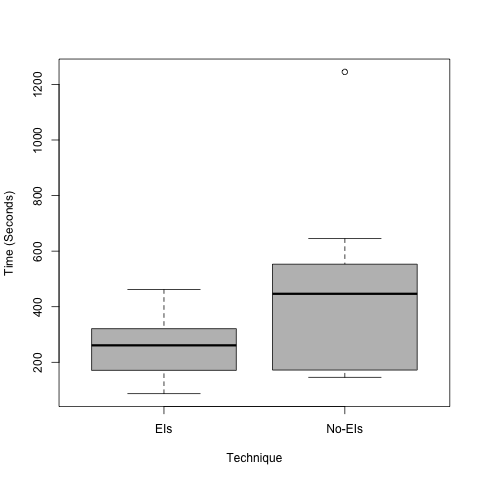
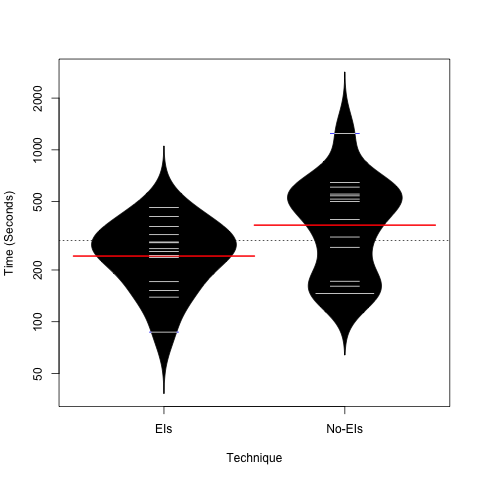
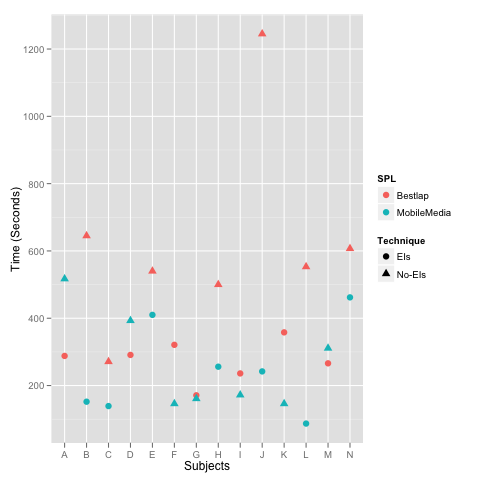
Graphics
ANOVA summary
| Df | Sum Sq | Mean Sq | F value | Pr(>F) | |
| replic |
6 |
81.516 |
13.586 |
0.8605 |
0.549665 |
|
| spl |
1 |
173.000 |
173.000 |
10.9578 |
0.006221 |
** |
| technique |
1 |
123.068 |
123.068 |
7.7951 |
0.016285 |
* |
| replic:subject |
7 |
267.751 |
38.250 |
2.4227 |
0.085284 |
. |
| Residuals |
12 |
189.455 |
15.788 |
|
|
|
|
--- Signif. codes: 0 ‘***’ 0.001 ‘**’ 0.01 ‘*’ 0.05 ‘.’ 0.1 ‘ ’ 1
Differences between both approaches
Standard deviation time without Emergent Interfaces: 293.523320300857
Standard deviation time with Emergent Interfaces: 105.017345506078
Standard deviation (all times): 235.044665348939
Mean time without Emergent Interfaces: 443.357142857143
Mean time with Emergent Interfaces: 262.785714285714
without / with: 1.68714324544713
Median time without Emergent Interfaces: 446.5
Median time with Emergent Interfaces: 261
without / with: 1.71072796934866
Time results without Emergent Interfaces:
517 645 271 393 540 146 161 500 172 1245 146 553 311 607
Time results with Emergent Interfaces:
288 152 139 291 410 321 171 256 236 242 358 87 266 462
Differences:
229 493 132 102 130 -175 -10 244 -64 1003 -212 466 45 145
Mean(No-EIs, Bestlap) = 623
Mean(No-EIs, MobileMedia) = 263.714285714286
Mean(EIs, Bestlap) = 275.857142857143
Mean(EIs, MobileMedia) = 249.714285714286
Tukey test for additivity
0.592724099625941
Bartlett test of homogeneity of variances
data:y and group
Bartlett's K-squared = 5.269 , df = 1 , p-value = 0.02171