Results for Round 1 - New requirement task
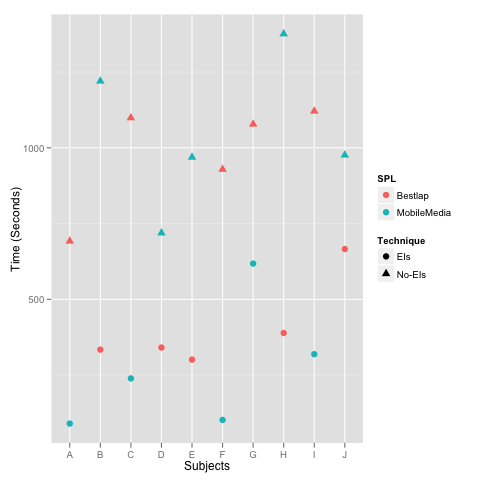
Time Data
| |
Replic |
Subject |
SPL |
Technique |
time |
| 1
|
1
|
1
|
Bestlap
|
No-EIs
|
692
|
| 2
|
1
|
1
|
MobileMedia
|
EIs
|
90
|
| 3
|
1
|
2
|
Bestlap
|
EIs
|
334
|
| 4
|
1
|
2
|
MobileMedia
|
No-EIs
|
1220
|
| 5
|
2
|
1
|
Bestlap
|
No-EIs
|
1099
|
| 6
|
2
|
1
|
MobileMedia
|
EIs
|
239
|
| 7
|
2
|
2
|
Bestlap
|
EIs
|
341
|
| 8
|
2
|
2
|
MobileMedia
|
No-EIs
|
719
|
| 9
|
3
|
1
|
Bestlap
|
EIs
|
301
|
| 10
|
3
|
1
|
MobileMedia
|
No-EIs
|
969
|
| 11
|
3
|
2
|
Bestlap
|
No-EIs
|
929
|
| 12
|
3
|
2
|
MobileMedia
|
EIs
|
102
|
| 13
|
4
|
1
|
Bestlap
|
No-EIs
|
1078
|
| 14
|
4
|
1
|
MobileMedia
|
EIs
|
618
|
| 15
|
4
|
2
|
Bestlap
|
EIs
|
389
|
| 16
|
4
|
2
|
MobileMedia
|
No-EIs
|
1376
|
| 17
|
5
|
1
|
Bestlap
|
No-EIs
|
1121
|
| 18
|
5
|
1
|
MobileMedia
|
EIs
|
319
|
| 19
|
5
|
2
|
Bestlap
|
EIs
|
666
|
| 20
|
5
|
2
|
MobileMedia
|
No-EIs
|
976
|
|
Graphics
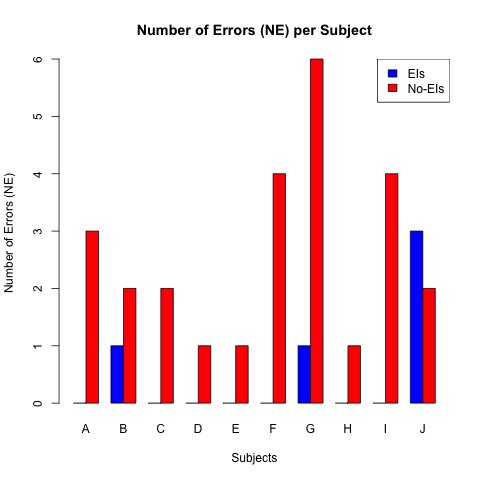
Errors Data
| |
Replic |
Subject |
SPL |
Technique |
errors |
| 1
|
1
|
A
|
Bestlap
|
No-EIs
|
3
|
| 2
|
1
|
A
|
MobileMedia
|
EIs
|
0
|
| 3
|
1
|
B
|
Bestlap
|
EIs
|
1
|
| 4
|
1
|
B
|
MobileMedia
|
No-EIs
|
2
|
| 5
|
2
|
C
|
Bestlap
|
No-EIs
|
2
|
| 6
|
2
|
C
|
MobileMedia
|
EIs
|
0
|
| 7
|
2
|
D
|
Bestlap
|
EIs
|
0
|
| 8
|
2
|
D
|
MobileMedia
|
No-EIs
|
1
|
| 9
|
3
|
E
|
Bestlap
|
EIs
|
0
|
| 10
|
3
|
E
|
MobileMedia
|
No-EIs
|
1
|
| 11
|
3
|
F
|
Bestlap
|
No-EIs
|
4
|
| 12
|
3
|
F
|
MobileMedia
|
EIs
|
0
|
| 13
|
4
|
G
|
Bestlap
|
No-EIs
|
6
|
| 14
|
4
|
G
|
MobileMedia
|
EIs
|
1
|
| 15
|
4
|
H
|
Bestlap
|
EIs
|
0
|
| 16
|
4
|
H
|
MobileMedia
|
No-EIs
|
1
|
| 17
|
5
|
I
|
Bestlap
|
No-EIs
|
4
|
| 18
|
5
|
I
|
MobileMedia
|
EIs
|
0
|
| 19
|
5
|
J
|
Bestlap
|
EIs
|
3
|
| 20
|
5
|
J
|
MobileMedia
|
No-EIs
|
2
|
|
ANOVA summary
| Df | Sum Sq | Mean Sq | F value | Pr(>F) | |
| replic |
4 |
276682 |
69171 |
2.3158 |
0.1451 |
|
| spl |
1 |
5184 |
5184 |
0.1736 |
0.6879 |
|
| technique |
1 |
2298420 |
2298420 |
76.9504 |
2.237e-05 |
*** |
| replic:subject |
5 |
193989 |
38798 |
1.2989 |
0.3528 |
|
| Residuals |
8 |
238951 |
29869 |
|
|
|
|
--- Signif. codes: 0 ‘***’ 0.001 ‘**’ 0.01 ‘*’ 0.05 ‘.’ 0.1 ‘ ’ 1
Differences between both approaches
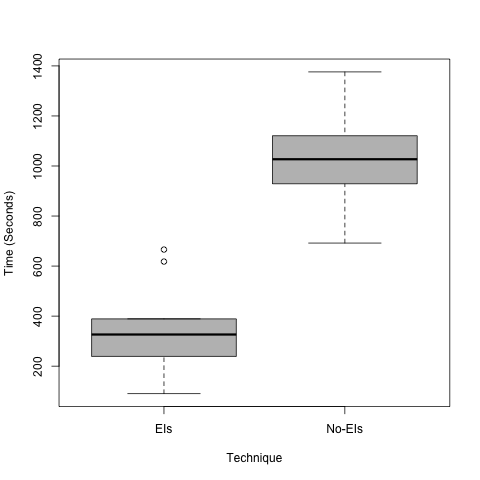
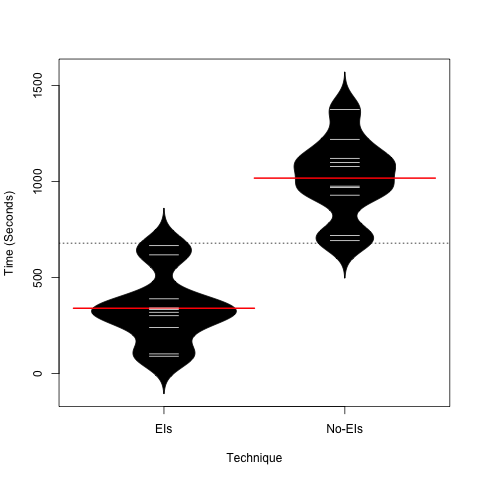
Standard deviation time without Emergent Interfaces: 210.158908130649
Standard deviation time with Emergent Interfaces: 187.766077873507
Mean time without Emergent Interfaces: 1017.9
Mean time with Emergent Interfaces: 339.9
without / with: 2.99470432480141
Median time without Emergent Interfaces: 1027
Median time with Emergent Interfaces: 326.5
without / with: 3.14548238897397
Time results without Emergent Interfaces:
692 1220 1099 719 969 929 1078 1376 1121 976
Time results with Emergent Interfaces:
90 334 239 341 301 102 618 389 319 666
Differences:
602 886 860 378 668 827 460 987 802 310
Mean(No-EIs, Bestlap) = 983.8
Mean(No-EIs, MobileMedia) = 1052
Mean(EIs, Bestlap) = 406.2
Mean(EIs, MobileMedia) = 273.6
Tukey test for additivity
0.682912314856735
Bartlett test of homogeneity of variances
data:y and group
Bartlett's K-squared = 1.7263 , df = 1 , p-value = 0.1889