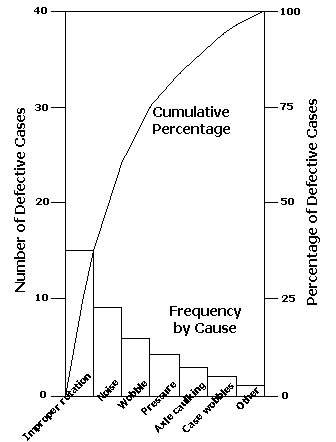
Figure 8-5.
Pareto Diagram
return to model
previous
next
 previous
 next
next  previous
next
previous
next